Congestion Charge
Note Congestion Charge in Central London currently operates from 7am-6pm Monday-Friday
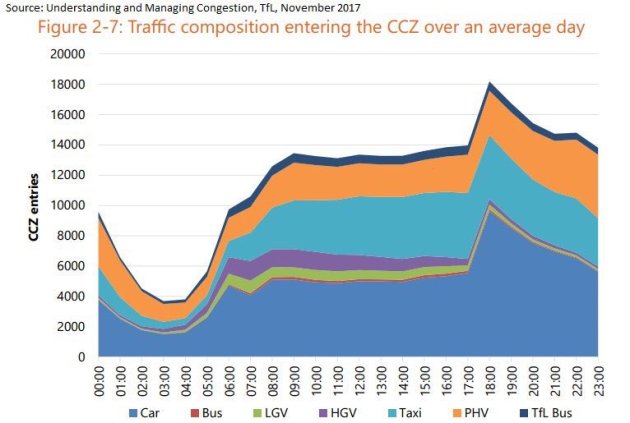
The first graph is from Understanding and Managing Congestion, Transport for London – November 2017
Here is 24/7 data on motor vehicle composition in the Congestion Charge Zone for cars, taxis and Private Hire vehicles from April 2017. It was a result of a Freedom of Information request and important new data
On 17 February 2003 the Congestion Charge was introduced by the Mayor Ken Livingstone covering the approximate area of the London inner ring road (21km sq / 8 sq miles)
London congestion is at its worst during the morning rush hour and the early days of the congestion charge had little impact on that critical time. This proved to be true also in the longer term. Average road speed on London’s main roads at rush hour is now 15mph according to Department of Transport (August 2015)
According to TfL figures, traffic levels over the past 10 years have gone down by 10.2% but journey times for drivers have remained flat since 2007. Total gross revenues of the congestion charge are small, representing only slightly more than 5% of total revenues for Transport for London. It costs a a lot of money to run, and raises a little money, but it has not resolved London’s congestion or pollution problems. London is officially the most congested city in Europe.
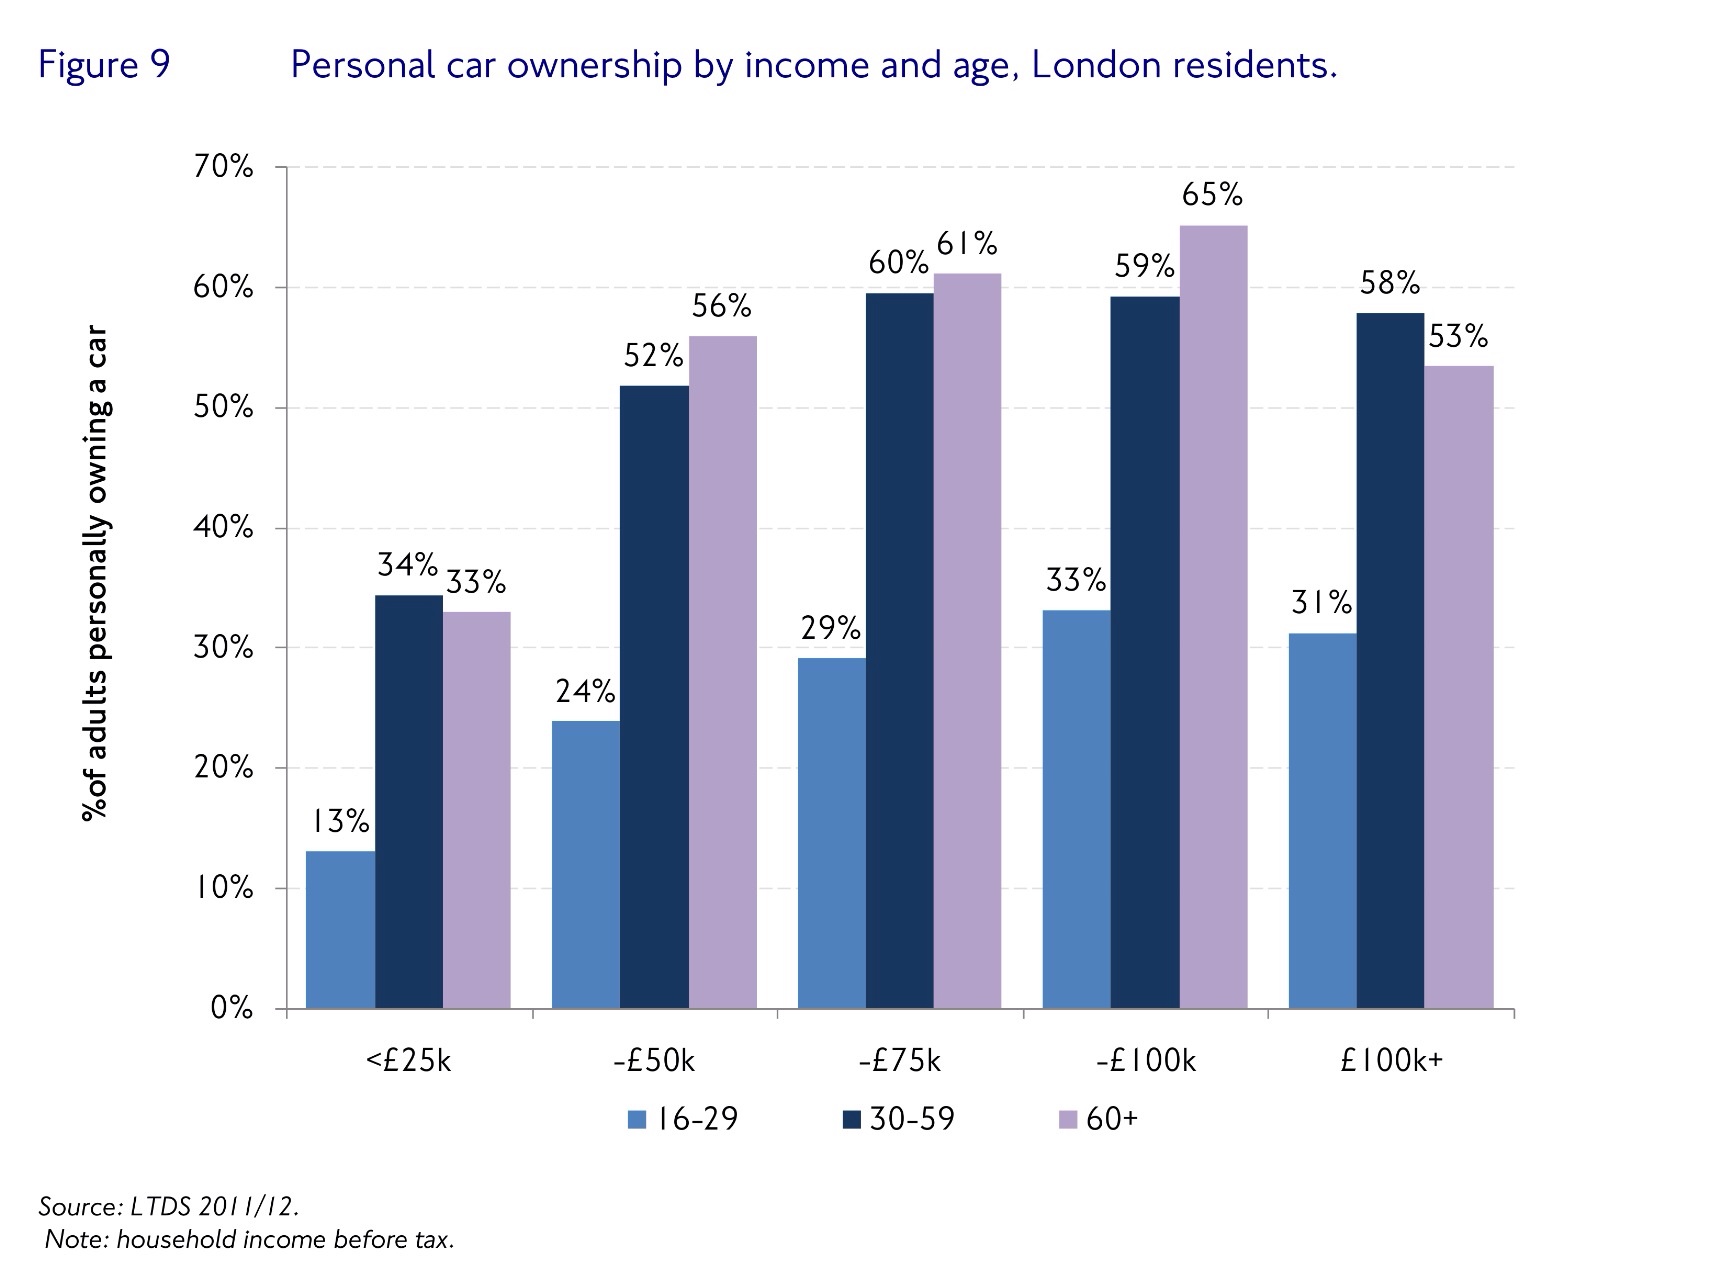
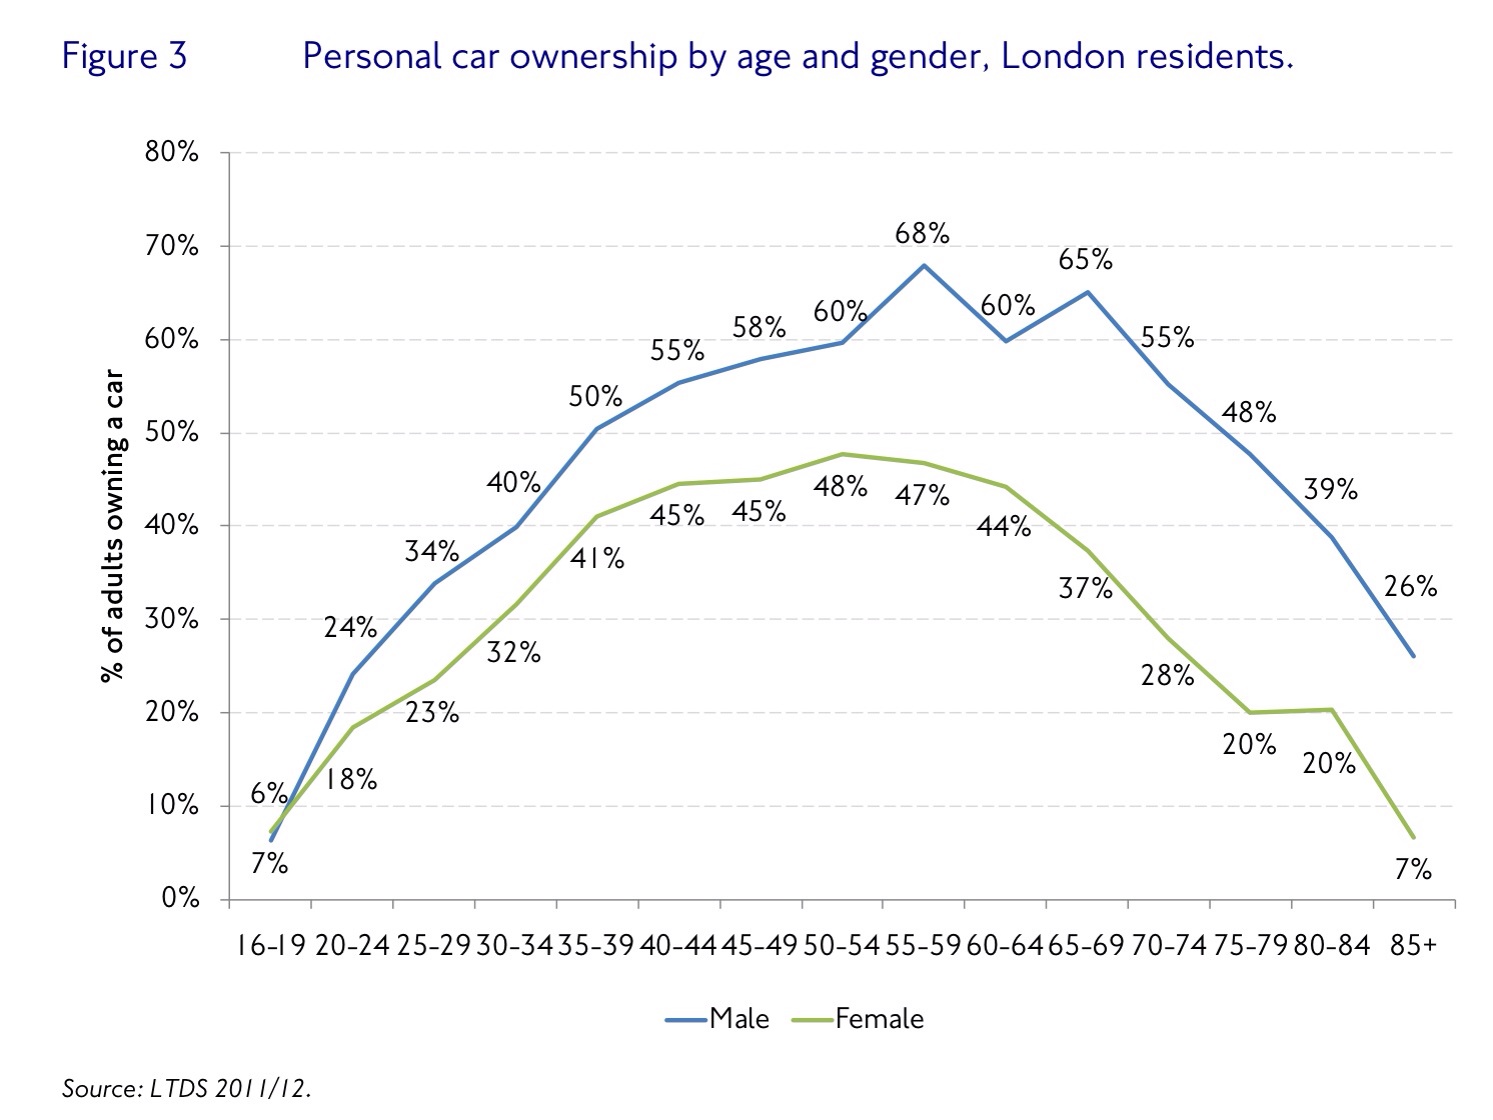
Youngest and poorest least likely to own a car
Statistically it is the wealthiest, male, white ethnic and middle aged that are most likely to own a car in London; this may well have been exacerbated by the congestion charge. Road charging does have some benefits but ultimately encourages the wealthy to drive on London’s streets. Low income, female, younger and older most likely to be disadvantaged. Not good for social cohesion.
Pollution
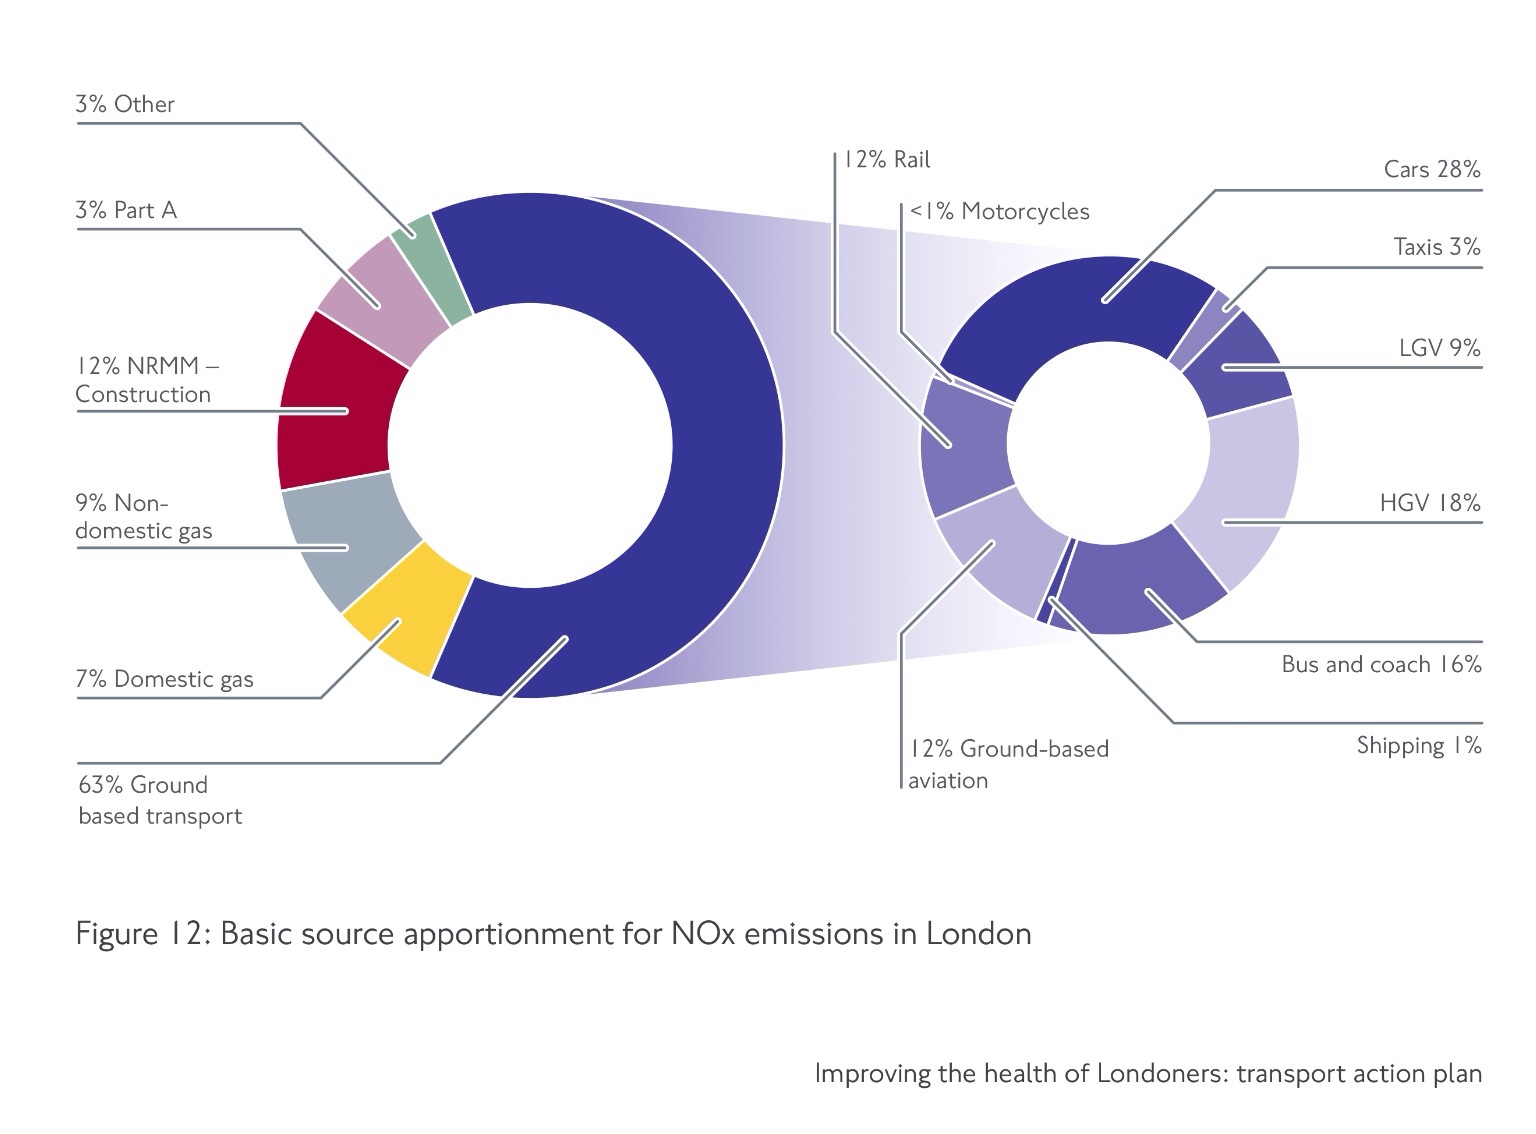
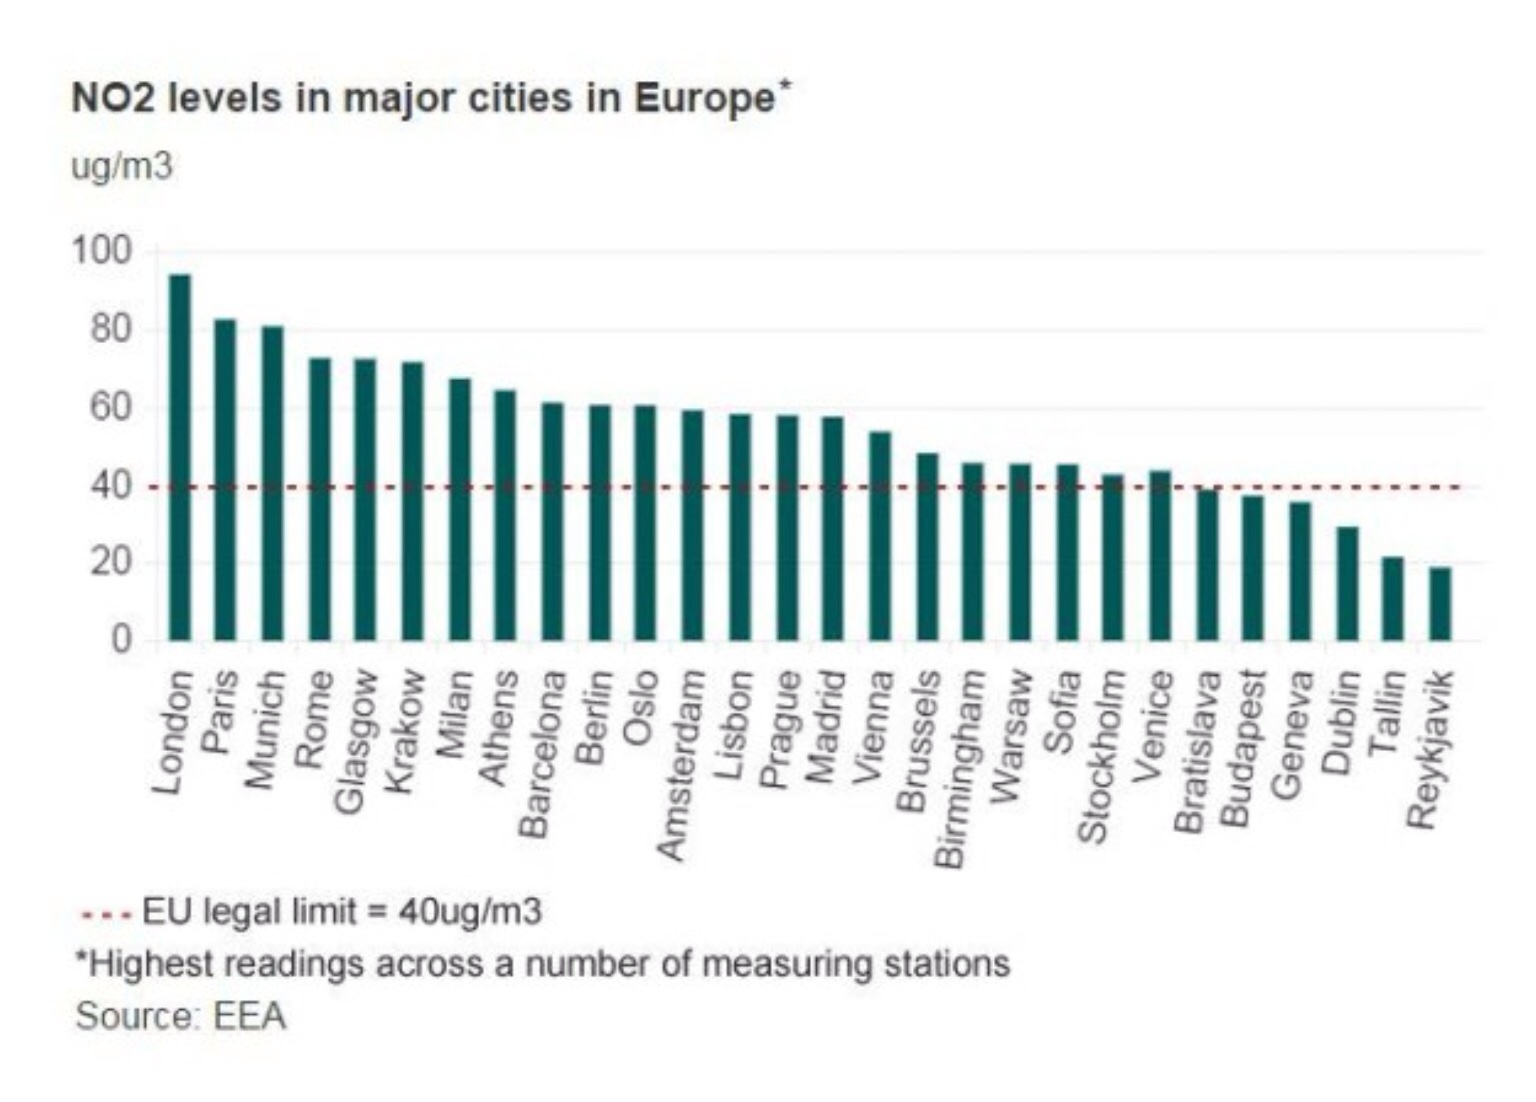
Cars contributing most to ground based NOx pollution
A 2011 independent study published by the Health Effects Institute (HEI), and led by a researcher from King’s College London , found that there is little evidence the congestion charge scheme has improved air quality. In fact in July 2014 it was reported that Oxford Street has the worst levels of nitrogen dioxide (NO2) air pollution in the world, according to an air quality scientist Dr Davis Carslaw at King’s College.
Each year in London around 9,500 premature deaths (by an average of 11 years) are attributable to poor air quality. London suffers from traffic related pollution in a similar way to most UK cities, but the sheer size of the city, along with a dense road network and high buildings, means that central London tends to be one of the most polluted places in the UK.
The most polluted place to be on the road is in a car or taxi. King’s College air quality scientist Ben Barratt monitored all five members of the Environmental Audit Commitee as they travelled through London by different modes. Car and taxi travel exposed them to several times more pollution levels of ‘Black carbon’ tiny particles of deadly soot than those walking on the pavement. Emissions from one vehicle often enter the air intakes of those immediately behind (pollution from one car is sucked into another or through windows, cars are not airtight). Pollutant concentrations are highest in the middle of the public highway.
 On 29th April 2015 Client Earth won a unanimous decicson in The Supreme Court, ordering the Government to take “immediate action” on air pollution. They must now come up with plans to address breach of EU limits by December 2015.
The Government was warned of danger to public health from a switch to diesel, but carried on nonetheless. Now there is a rush to find alternatives such as Electric Vehicles, hydrogen, LPG and driverless cars. Again lobbying by the motoring industry is vociferous and sometimes fraudulent, making claims of Zero Emissions (Renault UK) And more recently Nissan Leaf has been involved in legal action over the efficiency of its electric batteries. E waste from EV batteries and environmental cost of mining rare metals (lithium) are big concerns, as is recycling batteries on a massive scale. Also in UK, renewables only represent 19% of the electric grid, so just polluting somewhere else.
Killed and Seriously injured on London’s roads
TfL have estimated that the charge has led to a small reduction in road traffic casualties against a background trend of improvement across London and across the rest of Great Britain over the period. Cars and motorcycles have seen the biggest reduction in accidents, whereas bicyclists have seen a slight increase, which may reflect their increased numbers.
Pedestrians accounted for 51% of fatalities and 37% of injuries in 2012. Here is a breakdown of fatalities from 2006-2010.
- Pedestrians on a pedestrian crossing (25%)
- Drunk pedestrians (23%)
- Pedestrians not on a pedestrian crossing (19%)
- Pedestrians hit by buses or coaches (17%)
- Pedestrians hit by speeding vehicles (16%)
- Pedestrians hit by HGVs (14%)
- Pedestrians hit by motorcycles (7%)
- Pedestrians hit by vehicles while on a footpath (6%)
Hit-and-run
A total of 1,043 pedestrians in London— around 20 a week — and 896 cyclists plus motorcyclists and others were victims of motorists who drove off from accidents without stopping in 2013. In 2015 it was reported that there were 80 hit-and-runs in London per week. There is increasing concern about lawless streets.
Car ownership trends
London has traditionally low levels of car ownership when compared to the rest of the United Kingdom. In 2008, as many as 40 per cent of households in London did not own a car, as opposed to 25 per cent of households in the rest of the country. According to the local authorities, as of 2010 there were more than 3 million privately owned cars registered to London residents.
However the 2011 census revealed a ground-breaking change in car ownership in London. In 2001 in Southwark, 51% of households had no car or van. By 2011, that number was up to 58%. In Hackney, the story was even more dramatic – 65% of households are now car-free, up from 56% in 2001. Lambeth – 58% of households are car-free, up from 51% in 2001. Even in a car-centric borough like Wandsworth, 45% now have no car, up from 41% in 2001. And Westminster, the borough which brings you free car parking all weekend and which is viciously anti-cycling, a whopping 63% of households don’t own a car, up from 57% in 2001. In Lambeth, it’s now 58% car-free households, up from 51% in 2001. Even Kensington & Chelsea households are now 56% car-free, up from 51% in 2001.
New figures published in ‘Health Impacts of Cars in London’ by the Greater London Authority / Mayor of London September 2015 show even higher levels of car free households in Central London.


Central London has the highest number of car free households
As car ownership in London declines, other trends emerge. For example, local rental and car sharing schemes.
Another noteworthy trend concerns new drivers in London. The average age at which Londoners learns to drive has been steadily increasing over the past decade, with less than 30 per cent of Londoners aged between 17 and 20 owning a license.
This might be a consequence of the ever-increasing fuel prices, taxes, insurance and the general economic situation. Or that new technology is keeping them connected in other ways. Whereas baby boomers and generation X experienced status and freedom through private car ownership, the Millenials have other priorities. They like the flexibility of apps to synchronise their travel and prefer sharing schemes rather than the hassle of owning and running a private car. They value services and experiences over possessions.
Statistically it has been shown that there is a correlation between the rise of the internet and the decline in the number of young drivers. And the older a person learns to drive, the less they will drive. Rather than a rite of passage, as seen by previous generations, fewer young people in London consider having a car a necessity and many actively admire the ability to live without a car.
Cycling
London’s cycling revolution accelerated last year, with 2014 seeing new records for usage of the capital’s Cycle Hire scheme and overall cycling on the Transport for London (TfL) road network.
Across the TfL road network, London’s main roads, cycling levels in Quarter 3 of 2014/15 (14 September to 6 December) were 10% higher than in the same quarter the previous year, and the highest since records began in 2000. It was the fifth record quarter in a row. By the end of 2014/15, TfL forecasts a 12% rise from the previous financial year.
Last year was also a record for hires on London’s Cycle Hire scheme, with 10,023,987 journeys made – up 5% on 2012 (the previous highest year) and 25% on 2013. At Hyde Park Corner, one of the most popular docking stations, the total number of hires in 2014 was 37% higher (102,267) than in 2012 (74,515), despite Hyde Park being a major sporting venue during the London 2012 Games. Furthermore, total hires from Waterloo station were up 12% (158,494) compared to 2013 (141,518), suggesting more people are now using the scheme as a viable commuting option.
Copenhagen, 613mm
Amsterdam, 838mm
Space taken up by Parking
There were 6.8 million parking spaces in London in 2001 according to the Transport Statistic Users Group, which, based on the minimum parking space, would take up 78.33 km sq or 32.33 sq miles.
Of course these figures do not take into consideration access area so could be at least twice that.
‘The provision, cost and accessibility of parking influences driving behaviour. Parking also creates obstructions that can impair visibility of pedestrians to drivers. This can affect road safety and uptake of active travel, as well as contributing to community severance. The THSG have suggested that the provision of free parking in residential, commercial and town centres effectively subsidises car use, distorting the real costs of driving. This is because the costs of providing free parking are partially incurred by local authorities and commercial businesses.
The availability of parking in residential and commercial areas encourages driving and discourages active travel. New residential developments that have limited residential car parking to between 0.4–0.7 spaces per unit have seen reductions in car use.’ BMA Healthy Transport = Healthy Lives
Residents Parking Permits are incredibly cheap, as low as £40.00 per year and in some cases free. Private Parking in Central London costs from £2,000-£20,000 per year. This discrepancy in private and public parking means that some residents (illegally) sell on Residents Parking permits with a very healthy profit margin.
The discrepancy between Land values and Residents Parking Permits also encourages residents to use vehicles as extra storage.
The OECD report The Metropolitan Century – Understanding Urbanisation and it’s consequences says that storage of private property on valuable real estate is economically illiterate. ‘Public space is too valuable to be used for parking at subsidised rates that do not take into account all the negative externalities’
For businesses it is also very attractive to park a vehicle on the public highway as advertising and for as little as £40.00 per year. So who knows what these private vehicles parked on public space are actually doing there?
We do however have statistical data that says that the average private car is parked 95% of the time. (Donald Shoup) Which sums up the economical waste of public space.
Southampton Central charges £1000 per year for Residents Parking Permits. So where there is the political will……Otherwise the tax payer, as the BMA states, is effectively subsidising resident’s parking on the public highway.
Eighteen bicycles can be parked in the space of one car.
Active Travel
‘Physical inactivity has an impact on health comparable to that of smoking’ Dr I-Min Lee Harvard Professor of Epidemiology
Inactivity costs £10 billion per year in NHS services and absenteeism. A third of UK adults do not do a minimum of 30 minutes physical activity per week, the Chief Medical Officers minimum recommendation. Children should spend 1-3 hours per day doing moderate to vigorous activity for optimum health.
Percentage of schoolchildren aged 7-11 obese or overweight
— Netherlands 11%
— England 27%
The Dutch rate is among the lowest in Europe, the English rate among the highest.
Percentage of schoolchildren aged 13-17 obese or overweight
— Netherlands 9%
— England 25%
Again the Dutch rate is among the lowest in Europe, the English rate among the highest.
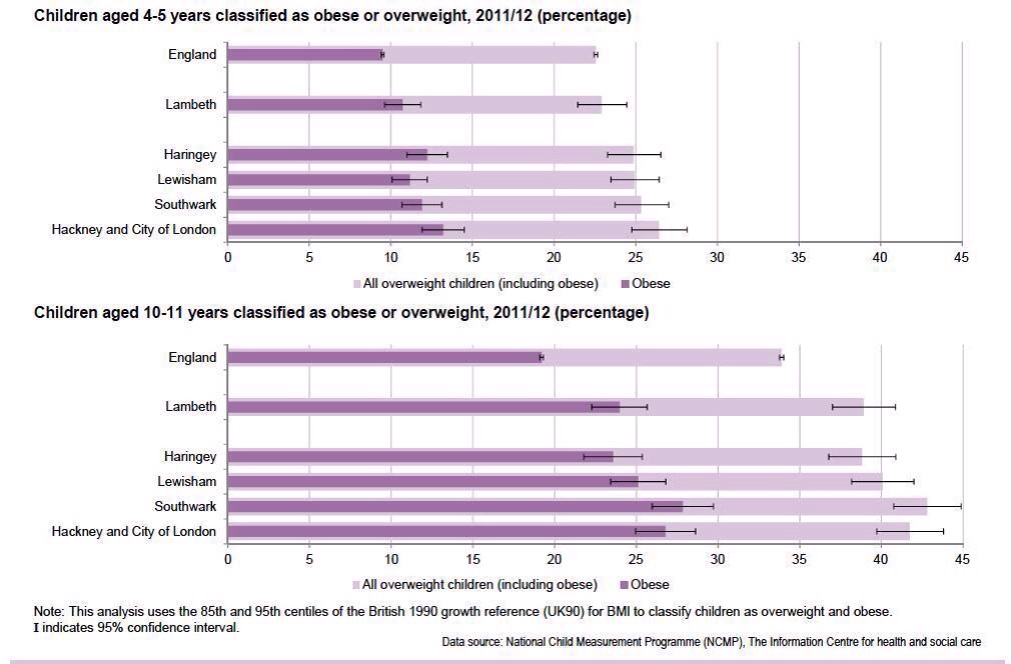
Shocking levels of childhood obesity in inner London
The Netherlands (along with Denmark, which sees much lower childhood obesity rates than the UK) also has the highest rates of active transport among kids, in particular cycling. Holland and Denmark, countries where cycling is a mainstream mode of transport have significantly lower levels of adult and childhood obesity. Obesity will bankrupt the NHS if a serious effort is not made to tackle the problem, the chief executive of NHS England has warned.
Flooding
The paving over of front gardens, often to park cars, has had a significant impact on the volume of water running into drains; in London there are 12 square miles of front garden under paving, equivalent to 22 Hyde Parks. Government reports estimate that over 80,000 homes are at very high risk from surface water flooding causing £270 million of damage each year.
Besides flooding there are many other environmental issues created by the increasing spread of paving:
- Oil, petrol & brake dust is washed off paving causing pollution in rivers.
- Older drains carry rainwater into sewers which can overflow into rivers.
- Local temperatures can rise (the urban heat island effect) due to less evaporation of water that would have soaked into the ground and more hard surfaces releasing heat absorbed during the day.
- Less vegetation means poorer air quality – trees play a major part in absorbing dust & pollution.
- Loss of habitat for wildlife.
Satellite pictures have shown that between 2001-11 the proportion of front gardens paved over in England increased from 28% to 48%.
The London Economy
In 2013 the average time spent by car drivers idling in traffic jams per year are 250 hours. This in turn cost the economy some £5.3 billion. These costs are estimated to rise to £9.07 billion by 2030, according to traffic information company Inrix and the Centre for Economics and Business Research.
Quotes
Richard Rogers, the Architect, has suggested that London become ‘a people space rather than the car space it currently is’.
The Prince of Wales, addressing the European Community Conference on the Urban Environment, considered how city planning has given “scour to such an extraordinarily voracious beast” as the automobile. His references to the ravages of the motor car, “which has tended to disfigure our cities more than anything else since the second world war”, certainly demonstrates part of his position on environmental issues. [London Times]
Florence Welch asked in the Evening Standard What would you do if you were Mayor for the day?
A day of no cars, just everyone on bicycles. I love to ride mine around London — it’s a black vicar’s bike.
The head of Volvo said, “In the future, there will be one solution: to ban cars from cities.” (Montreal Gazette, 4 Aug 1990)
Jon Snow said ‘If I were King for a day I’d ask everyone to abandon their car’ [The Guardian]
Leonardo DiCaprio said at the 2014 Climate Change at the UN ‘Clean air and water are inalienable human rights’
Bertrand Delanoe, former Mayor of Paris ‘The fact is that cars no longer have a place in the big cities of our time’
Jeremy Clarkson ‘Get rid of your car, you don’t need it’ [The Sunday Times]
Richard Branson ‘ I believe whole streets should be closed to all vehicles except bikes. What do you think of this idea?’ Twitter
Alex Proud ‘Private cars are the problem’ [The Telegraph]
Ben Fogle ‘I’d be quite happy if cars were banned from Central London. I don’t know why we still allow it.’
Ben Goldacre ‘Cars in cities are a stupid idea’ Twitter
Carbon Emissions
NASA says “Cars, buses, and trucks release pollutants and greenhouse gases that promote warming, while emitting few aerosols that counteract it. In contrast, the industrial and power sectors release many of the same gases—with a larger contribution to radiative forcing—but they also emit sulfates and other aerosols that cause cooling by reflecting light and altering clouds…’
In their analysis, motor vehicles emerged as the greatest net contributor to atmospheric warming now and in the near term, with a total radiative forcing of 199 mWm-2 in 2020.
‘Transportation, driven by rapid growth in car use, has been the fastest growing source of C02 in the world’ – Michael Replogie
1 billion cars worldwide predicted to rise to 2 billion by 2020 – Bikes vs Cars
Private Cars in the UK contribute 12% of Uk Greenhouse gas emissions.
http://www.healthylifeessex.co.uk/pages/outdoor-life/Front_Garden_Paving.html
http://www.telegraph.co.uk/motoring/news/8411336/EU-to-ban-cars-from-cities-by-2050.html
http://roadpricing.blogspot.co.uk/2013/02/10-years-of-londons-congestion-charge.html
http://www.theguardian.com/cities/2014/jul/10/live-debate-ban-cars-city-centres-pedestrianisation
http://saferoxfordstreet.blogspot.co.uk/2014/04/visit-london-die.html
http://www.economist.com/blogs/blighty/2013/09/cycling-london
http://www.newstatesman.com/lifestyle/2013/08/death-rides-bicycle-why-riding-bike-so-often-lethal
http://londonist.com/2013/11/three-pedestrians-die.php
http://londonist.com/2013/11/wont-somebody-think-of-the-pedestrians.php
http://cyclelondoncity.blogspot.co.uk/2012/12/census-data-car-free-households-now.html
http://www.theguardian.com/environment/2014/jul/10/uk-cities-breach-eu-pollution-limits-2030
http://www.uncsbrp.org/driving.htm
http://www.theguardian.com/uk-news/davehillblog/2014/jan/25/jan-gehl-london-talk-and-interview
http://www.telegraph.co.uk/motoring/news/8411336/EU-to-ban-cars-from-cities-by-2050.html
http://www.theguardian.com/commentisfree/2014/apr/11/cities-air-pollution-cleaner-bristol-bogota
http://www.thetimes.co.uk/tto/public/cyclesafety/article3816510.ece
http://www.entrepreneur.com/article/231065
http://www.leftlanenews.com/hamburg-germany-to-ban-cars-in-2034.html#ixzz3E2MabgKa
http://www.businessinsider.com/china-is-building-a-nearly-car-free-city-2012-11?op=1
http://www.citylab.com/commute/2014/01/europes-most-congested-city-contemplates-going-car-free/8027/

It has been statistically proved that car owners do the least active exercise. High investment in a vehicle parked right outside your front door, encourages its use even to go a few minutes down the road. This creates an obesogenic environment. Car users are becoming an immense burden on the NHS.
Even people who take public transport walk to the bus stop. Building more leisure centres has not increased active exercise. Having safe space and infrastructure to cycle and walk safely and build it into daily life creates the best conditions for regular exercise habits. Take away those parking spaces!